You’ve heard of Twitter, but are you familiar with Twitter Analytics? Twitter Analytics was previously only available to advertisers and verified users, but within the last week, it became available to all. As such, we feel obligated to provide a quick and dirty introduction.
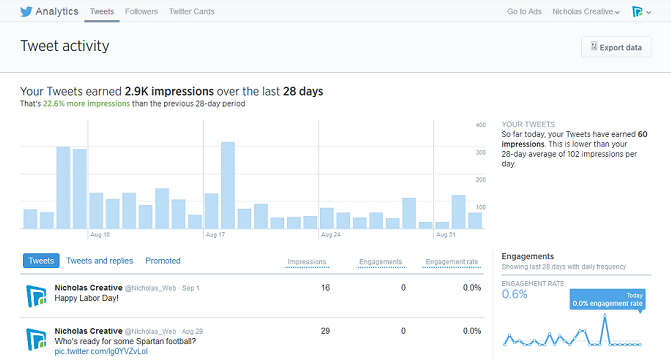
The Twitter Analytics dashboard provides data for each individual tweet, including replies and promoted tweets. The data includes impressions, engagements and engagement rate.

Impressions are simply the number of times users see each tweet, while engagement measures the number of times a tweet receives interaction. This most commonly includes retweets, replies to tweets and tweets receiving clicks—but it goes far beyond that. Engagement also includes:
- Clicks on hashtags, usernames (Twitter handles) and avatars.
- New followers.
- Expanded tweets.
- The engagement rate is determined by dividing engagements by impressions.

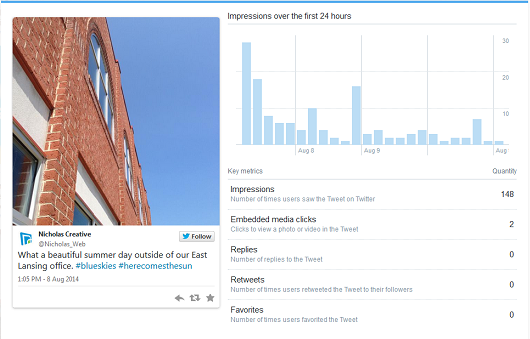
From the Twitter Analytics dashboard, click a specific tweet to reveal deeper metrics. The individual tweet analytics shed light on how users are engaging with tweets. See the screen capture above for an example of how users engaged with a photo tweet.
Twitter Analytics is also useful for gaining insights on your followers. The Followers tab provides a breakdown of users’ interests, demographics and more.
Twitter Analytics provides marketers valuable information for creating a social media plan. It helps to determine the type of tweets with which followers interact compared to those that tend to be ignored. And seeing as Twitter Analytics is still in the early stages, it can only get better!
To check out it for yourself, visit analytics.twitter.com.